[This post content is developed from another blog post originally published here.]
When I met with a colleague to talk about her Orals, she very kindly told me she had no idea how I managed all of the things that I do. I admitted that sometimes I only just barely manage to do them, and I said exactly the same thing to her. We both juggle multiple jobs, projects, talks, leadership roles, hobbies, trips, and so on. It’s hard to keep track of it all! So when it came time to meet with my dissertation committee for our annual meeting, I knew that making photocopies of my CV wouldn’t give them a real, tangible update on my progress.
My fiance is a financial consultant at one of “The Big Four” in New York City, and he just so happens to have an MA in Philosophy, so when I go to him for advice about project management or grant proposal writing, he has unique insight into both the business world and academia. In Part II of this series, I’ll tell you more about grant writing with the STAR method, but for this post I want to focus on why academics should consider creating Gantt charts to map out their time and manage it better.
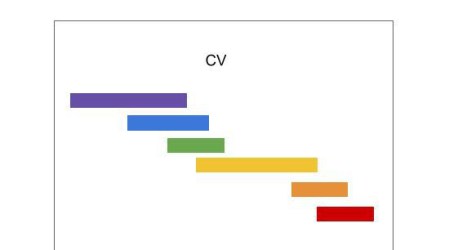
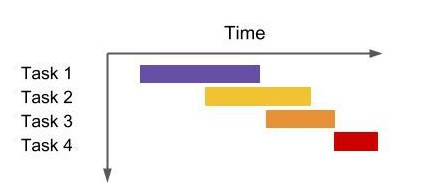
What’s a Gantt Chart?
A Gantt chart is a map of your project’s schedule across time. The tasks that need to be completed are listed on the left side, or the vertical axis (and you can break them down into micro-tasks), and the time it will take to complete those tasks is broken up into intervals (of your choice) at the top, along the horizontal axis. Then you fill in the amount of time you’ll need/have for each task to be completed, creating a bar chart for your schedule. It’s a great way to see what you do all mapped out into a coherent timeline, and it’s also a way to foresee potential delays (vacation time, etc.) and manage or find a way to work around those delays.
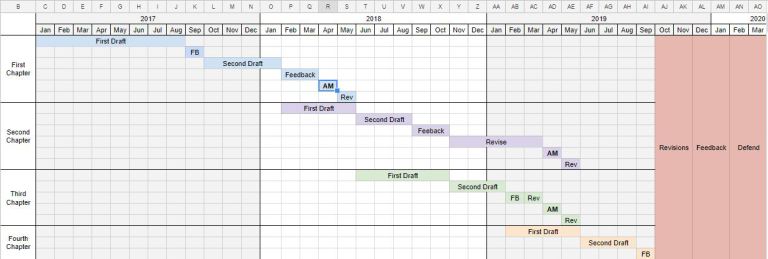
 In the Gantt chart I made for my dissertation (I used Google Sheets but you could also use Excel) you can see exactly where I am in my dissertation writing at the time of this post in April 2018. I’m nearly done with my first chapter and well into drafting my second. Drafting the first chapter took me a long time in 2017 but so far the second chapter is going much faster because I lightened my workload in 2018. I can reasonably predict how the rest of my writing will go, and account for summer and winter breaks as well as when my adviser will be available to give me feedback (“FB” in the chart).
Be Realistic with Goal-Setting
Things come up. A student suddenly takes up all of your office hours in crisis. Or there are too many amazing speakers and late night events in one week. It’s easier to make goals attainable with a Gantt chart because you can anticipate some delays well in advance and also use how much time you’ve spent on a task in the past to predict how long it’ll take you to complete a similar task in the future. But, as my partner says, it can all go down the drain in an instant when something unpredictable happens–and when doesn’t something come up? It’s good practice to add a little cushion to each phase of a project. That’s why I kept my timescale monthly and fairly macro-level.
Why Academics Could Use More Gantt Charts
They aren’t for everyone but Gantt charts have helped me write timelines for project budget proposals that won grants, and a Gantt chart is now helping me keep all the plates spinning in the air so they don’t break. Now I have a better sense of what I do, how I do it, and I have good reasons for why I need to say no to some things and yes to others.
I feel somewhat relieved. I’m managing my work stream instead of constantly putting out fires and anxiously assuming that I’m forgetting something. Worrying wastes energy. The only things not on the chart are my leadership roles and committee work, but those timelines are week-to-week and specific–that’s what my Google calendar is for.
You can see the full Gantt chart here, and read the full post here.