I recently used Cytoscape – an open source platform for network analysis – to visualize the distribution of race and ethnicity among the deceased that law enforcement agencies killed in 2015 and 2016. I wanted to see which law enforcement agencies targeted which demographics of victims. I plan to use the information to focus activist watchdog efforts on those agencies with the most fatalities for one or more groups and alert those populations that are most in danger.
In the first visualization, we can see that Asian-Pacific Americans, Whites, Hispanic-Latinos and Blacks were most in danger of being targeted by law enforcement agencies in 2015. There is a high concentration of lines between Hispanic-Latinos, and Blacks, however, which suggests that they were the most targeted overall by all agencies. Whites were also highly targeted en masse, though 75% of their fatalities seem to be attributed to separate departments, whereas the other 25% they share with Asian-Pacific Americans, Hispanic-Latinos and Blacks. The circular ring around the Blacks node suggests that they were regularly targeted by the same agencies.
In 2016, Asian-Pacific Americans and Hispanic-Latinos are pulled further into the middle of the network, which could be due to there being targeted by the same departments. Unknowns, too, were pulled a bit further into the mesh, sharing commonalities with Asian-Pacific Americans, Hispanic-Latinos, Blacks and Whites. Several trends continue in 2016: 75% of White fatalities are from separate agencies, while Blacks are habitually targeted by the same agencies.
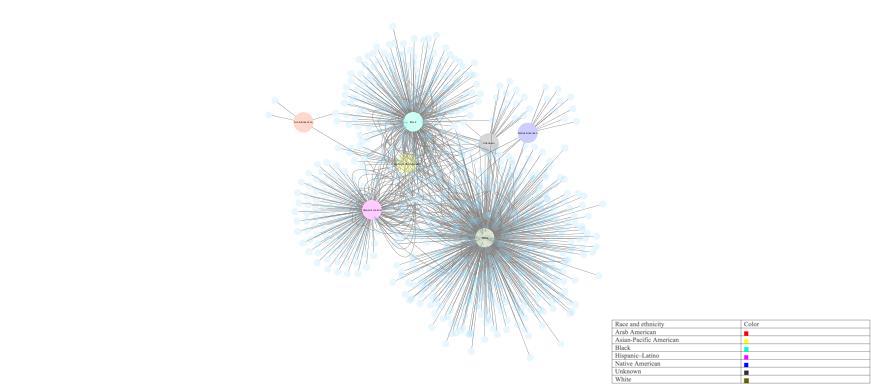
Network graphic for 2015 data in Cytoscape.
What struck me about both networks was how Arab Americans and Native Americans were time and again out of the network. They had less fatalities overall and seemed to have been targeted by specific departments; they had little in common with other racial and ethnic groups. That is not to say, however, that they are not in danger.
In 2015, Unknowns were close to Native Americans. A year later, Unknowns were pulled into the center of the network, sharing lines with Asian-Pacific Americans and Hispanic-Latinos. If the trend continues, then Native Americans will be at risk. It would only take a year for them to become invocated in the mesh like the Unknowns. I am not sure what to make of the Arab Americans node, however, as there is too little data to make any conclusive inferences.
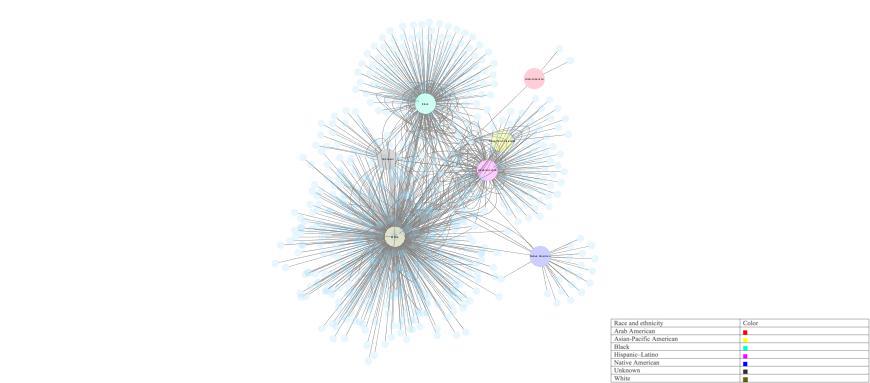
Network graphic for 2016 data in Cytoscape.
Ultimately, I drew the following conclusions from the visualizations. First, Whites have the most fatalities, which are mostly from separate law enforcement agencies. Second, Asian-Pacific Americans and Hispanic-Latinos are gradually being targeted by the same agencies. Third, Blacks are routinely harassed by the same agencies and are starting to be targeted by the same agencies that target Asian-Pacific Americans and Hispanic-Latinos, thus pulling them further into the center of the network. Fourth, Native Americans are most in danger of being pulled into the mesh.
Cytoscape was useful for visualizing the data that I gathered from The Guardian’s “The Counted” project. Nonetheless, I wish that there was a way to layer the two networks on top of each other. Doing so would have enabled me to make manifest the shift in the network from 2015-2016, as well as to make clearer my prediction of Native Americans being most in danger. But I concede that Cytoscape is an extremely useful and accessible platform for visualizing complex data. The conclusions above are my own idiosyncratic observations and I am sure that they just scratch the surface of the much larger problem of law enforcement agencies targeting certain demographics. Consequently, it is our job as American citizens to focus activist watchdog efforts on law enforcement agencies en masse to reform the militarization of police officers.
THUMBNAIL COURTESY OF THE GUARDIAN’S “THE COUNTED” PROJECT