-
Clean Air Survey

We chose to adapt the OPAL Air Survey in a few ways that improve upon the delivery of the survey. The OPAL Air Survey is an ambitious project that uses Lichen growing on trees to measure the relative health of the local air. Lichen are highly sensitive to air quality and have been used to detect…
-
PressureNet: Great Beginner Citizen Science Project
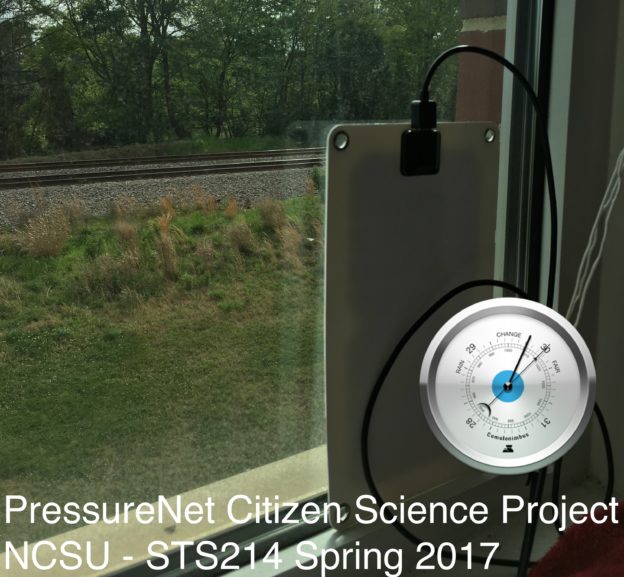
Project: PressureNet By: Samuel Cynamon, Corey Atkins, Jialang Li We chose this project because it offers a unique opportunity to start a new initiative on campus to aide in the crowdsourcing weather app using recycled phone, and solar energy. Normally users just need to have it downloaded on their phone to allow the automatic reporting system to…
-
Plant Bot for Project BudBurst
Plant Bot Here is the link to the existing project: https://scistarter.com/project/41-Project-BudBurst http://budburst.org/getstarted The citizen science project that we chose to adapt was the Project Budburst. The goal of this project is for citizens to observe plants and submit their data in order to help scientists with their goal of understanding how plants respond to climate…
-
Kroski’s hands-on sourcebook for makerspaces

Facet Publishing have announced the release of The Makerspace Librarian’s Sourcebook. Makerspaces are drawing new users into libraries and engaging them as never before. Edited by technology expert Ellyssa Kroski, The Makerspace Librarian’s Sourcebook, is a must-read for any librarian using technology in teaching and learning as well as those considering whether to set up…
-
Announcing #SocialDiss: Transforming the dissertation into networked knowledge production
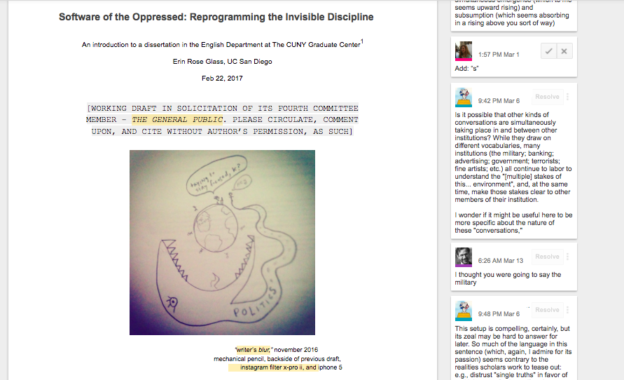
To what extent can the general public participate in and benefit from the production of a dissertation? How might the private and anxiety-ridden processes of education be transformed into a public good and social joy? Are the imperfect artifacts of learning to be hidden and disposed of as shameful waste, or might they provide fertile…
-
Bad Kids Save the World

Playground City has had three main focuses during the last three months: 1) Develop a suite of playlists that engage youth in their local food environment; 2) Connect with our learners where they are, and understand their learning identities by asking questions; and 3) Begin to address structural unemployment; i.e., understand employers’ hiring identities by…
-
Data Visualization in R: ggplot, plotly, googleVis and igraph overview

My recent workshop on Visualization in R. There are four different packages in R to visualize data: ggplot2, plotly, googlevis, igraph. In this hands-on workshop you will learn some basics of each package. Slides: https://www.slideshare.net/obscrivn/r-visualization-ggplot2-googlevis-plotly-igraph-overview Data set: http://tutorials.iq.harvard.edu/R/Rgraphics/dataSets/landdata-states.csv (image credit: https://community.uservoice.com/blog/data-visualization-best-practices/)
-
Codecademy: Educational Institution?
Most people use smartphones or laptops to communicate with one another and are aware of the fact that programming is a significant component behind making these things work. The issue at hand is that the majority of these people do not know how to write code. Two reasons for this would be that the person…
-
Data Visualization: Introduction to Shiny Web Applications

With the growing interest in interactive web applications for data visualization, the mastery of reactive frameworks, such as Shiny, becomes a valuable skill set in data science and digital humanities. Shiny is the analytical dashboards package created by R Studio, one of the key promoters and developers of R. It allows for rapid prototyping and deployment…